
National Scale Monitoring Solutions
Prism Datum design and deliver advanced data platforms that transform complex monitoring data into clear, actionable insight.
From automated sensors to manual survey inputs, we aggregate, process, and interpret data at scale - supporting infrastructure owners with the visibility and confidence needed to manage risk, plan maintenance and operate safely.
Why Prism Datum?We understand the operational and regulatory challenges of working across the UK rail network—where data must be accurate, traceable, and defensible at all times.
We are experienced in environments with:
Complex, distributed monitoring systems across geographically dispersed assets
Strict safety, compliance, and assurance requirements
Legacy systems and fragmented data from multiple suppliers and contractors
High volumes of both automated and manual monitoring data
The need for clear, auditable engineering insight at every level
Our platforms and services are designed specifically for these conditions - robust, transparent, and built to support real-world railway operations at scale.
Built for the Realities of Railway Engineering
Modern infrastructure monitoring generates vast volumes of data from multiple systems, suppliers, and survey methods - but without the right tools, critical signals can be missed.
We solve this by delivering systems that:
Ingest and standardise data from diverse monitoring technologies
Detect movement, trends, and anomalies across assets and time
Combine automated and manual monitoring into a single, coherent view
Deliver clear, decision-ready outputs for engineers and asset managers

Survey Compliance & Health Management
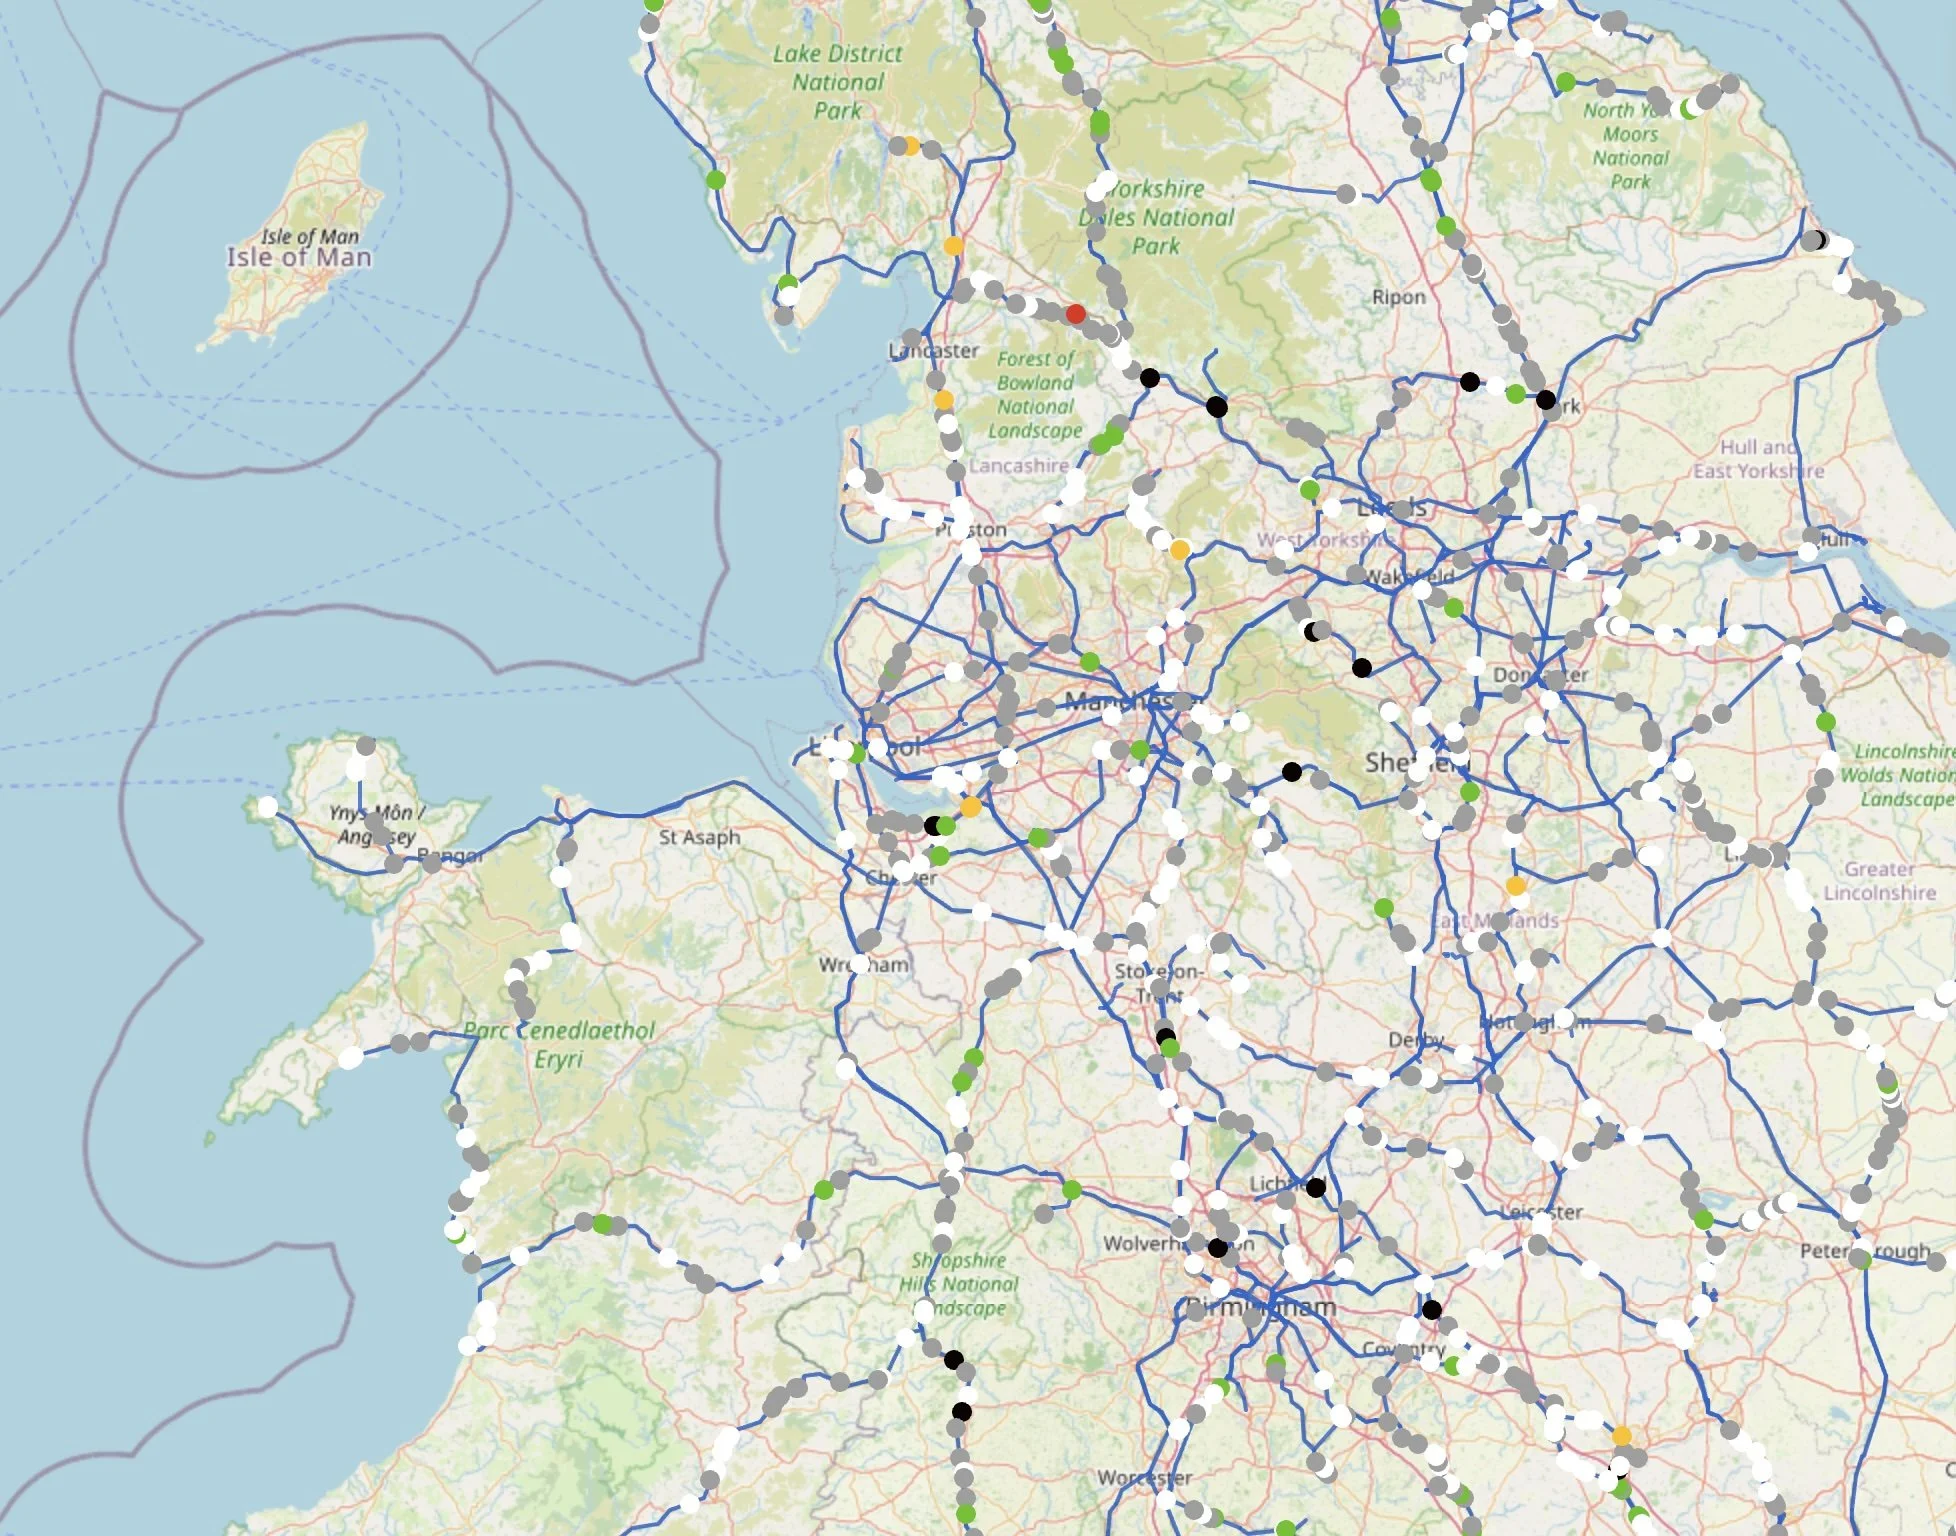
We provide structured data environments that give full visibility of monitoring system health and survey compliance—across entire regions, down to individual data points.
Our solutions enable you to:
Monitor the operational health of RCM and automated sensors, identifying failures, dropouts, and data gaps
Track manual survey delivery against required frequencies, highlighting missed or overdue measurements
Correlate expected survey schedules with actual submitted data to provide real-time compliance status
Drill down from regional overviews to individual sites, instruments, and readings
Maintain a fully auditable history of survey activity, data changes, and compliance performance
This provides both an immediate view of monitoring reliability and a defensible, traceable record of compliance—supporting assurance, reporting, and informed decision-making.

Real-Time Survey Processing & Reporting
We deliver real-time and near real-time processing pipelines that transform raw survey data into validated, actionable outputs as soon as it is received.
Survey data is submitted directly from site and immediately ingested, processed, and validated. Where anomalies are detected, survey teams are given the opportunity to review and qualify results before they are released - reducing false positives and ensuring data integrity.
Capabilities include:
Direct ingestion of raw data from sensors and manual survey teams
Automated validation, processing, and interpretation of incoming measurements
Controlled review workflows for anomalous or failed validation results
Seamless ingestion into SurveyOptics for visualisation and analysis
Automated generation and distribution of full survey reports
Live dashboards and alerting for critical movements
This ensures that data is not only processed quickly, but verified, contextualised, and ready for confident decision-making without delay.

Bespoke Software Tools
Alongside SurveyOptics, we design and build bespoke software tailored to specific project and client requirements.
We can:
Develop custom data processing and integration pipelines
Build standalone applications or extend existing platforms
Integrate with third-party systems and legacy infrastructure
Design and implement interactive visualisations, dashboards, and reporting tools
Adapt quickly to unique monitoring, reporting, or workflow needs
From back-end data engineering to front-end visualisation, our solutions are designed to fit seamlessly into your operational environment—ensuring complex data is not only processed effectively, but clearly understood and acted upon.
SurveyOptics is our flagship platform, designed to provide a scalable, unified view of infrastructure performance.
Built for large and complex asset portfolios, it enables you to:
Monitor network-wide conditions through a single interface
Drill down into individual assets, sites, and sensors
Track changes over time with high precision
Integrate data from multiple hardware providers and survey contractors seamlessly
SurveyOptics turns fragmented datasets into a structured, accessible, and highly scalable system for asset intelligence.